Navigating the Portal
The dHealth Knowledge Portal is designed to highlight and provide access to different types of data and related information and resources. The main purpose of the portal is for you to explore data and resources, but there are many ways to arrive at your information of interest. Let’s go through the different portal components so you can use the site to best suit your needs. Some of the sections below have labelled screenshots to help explain.
Home
The homepage is designed to offer different ways of arriving at resources of interest for you to browse. First, you can click on any of the four Explore cards to arrive at those pages (Collections, Data, Tools, or Publications).
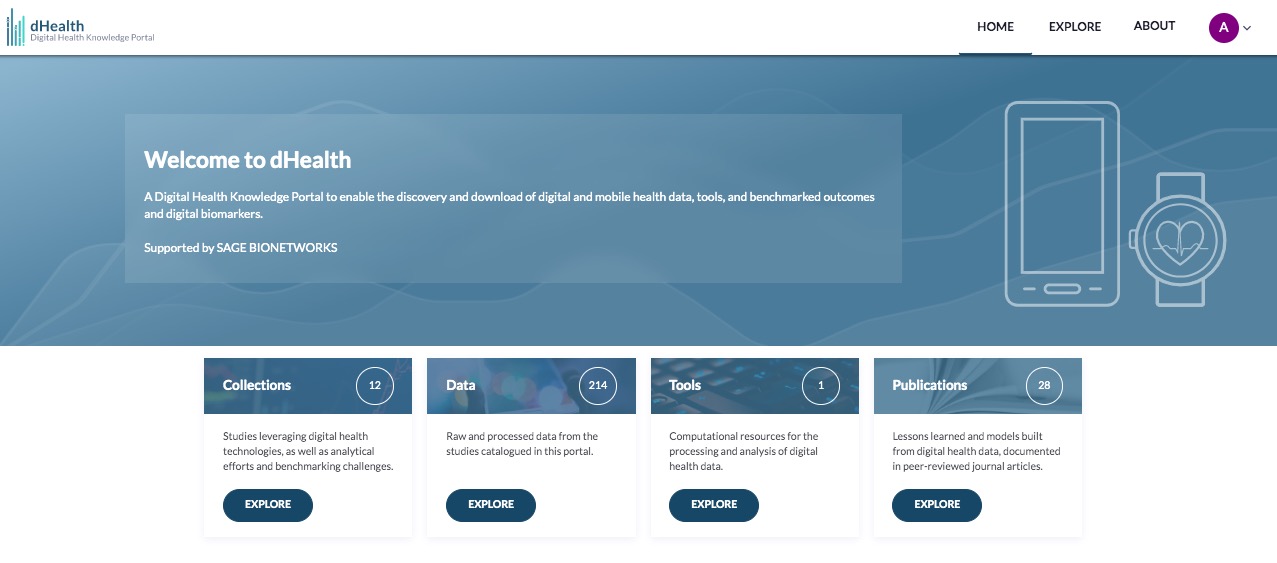
You can also access any of these pages via the Explore menu tab.
Collections
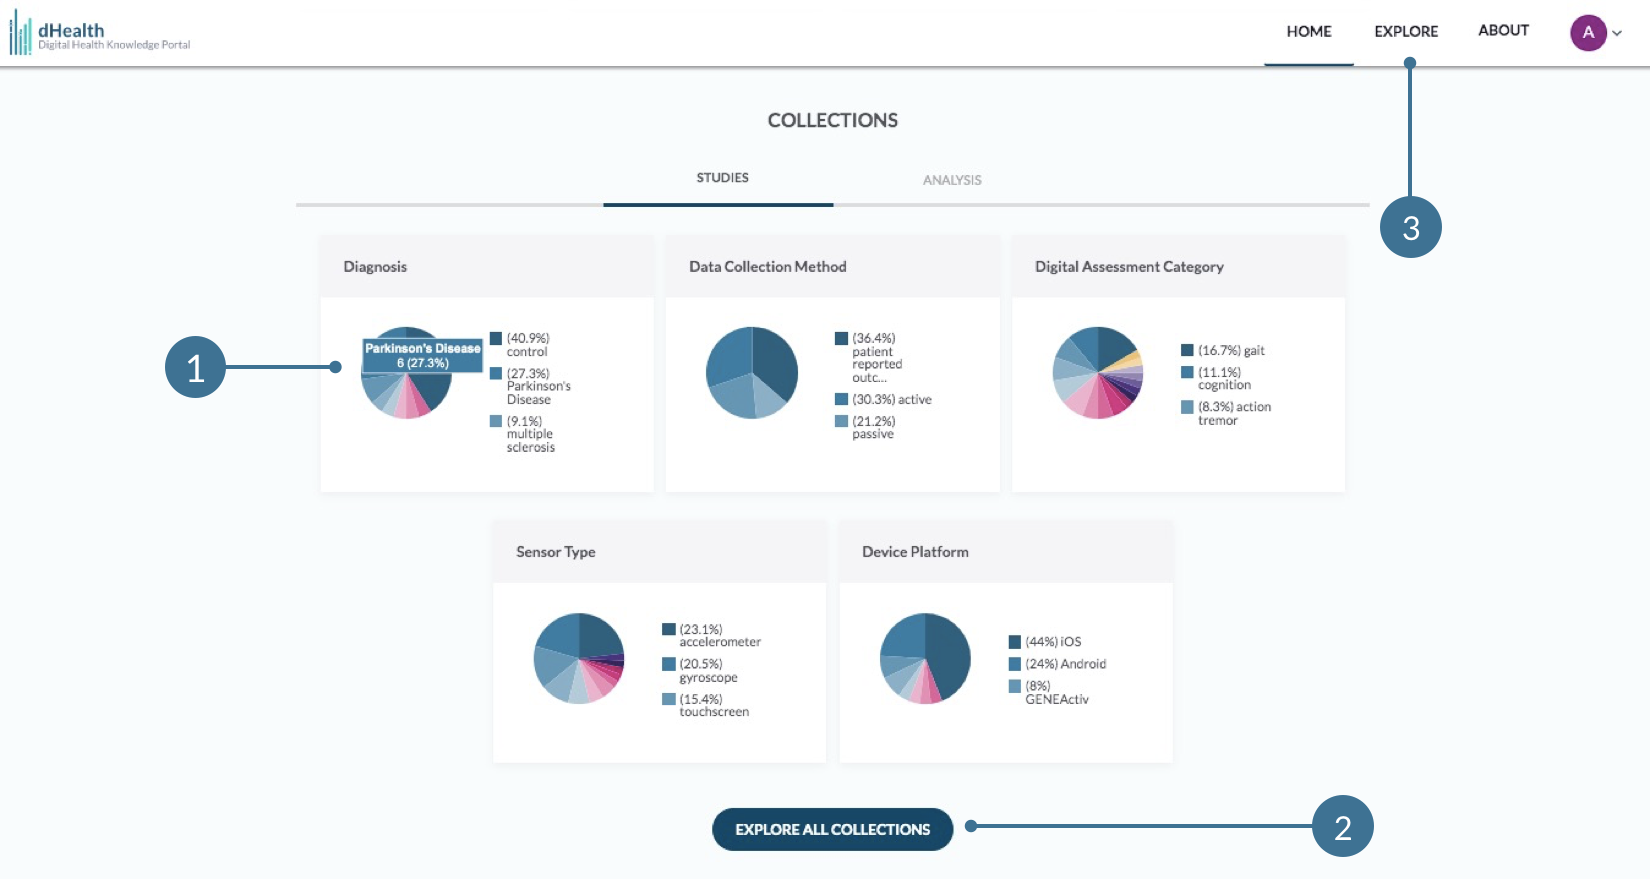
Collections include the studies and analyses contained within the portal. This section of the homepage is provided to visualize the characteristics of these collections. Toggle between the Studies and Analysis tabs to see various pie charts that offer a breakdown of different data collections by category. Notice that if you hover over any colored slice of any pie chart, it will reveal more details about that pie slice (1). Click Explore All Collections (2) to go to the Explore - Collections page. You can also arrive there via the Explore menu tab (3).
Below the visualizations, check out the What’s New section for a series of news posts.
Explore
The Explore section is where you can find information about data and other resources. This information is organized into categories, represented by the subtabs under the Explore tab in the navigation menu. You can explore data by Collections, Data, Tools, or Publications. More details on each of these categories is provided below, along with labelled screenshots to help orient you within each page.
Each of these Explore pages is displayed in the same way. You will find a Filter Data By section on the left (4), a visualization section on top (5), and a list of resources just below (6).
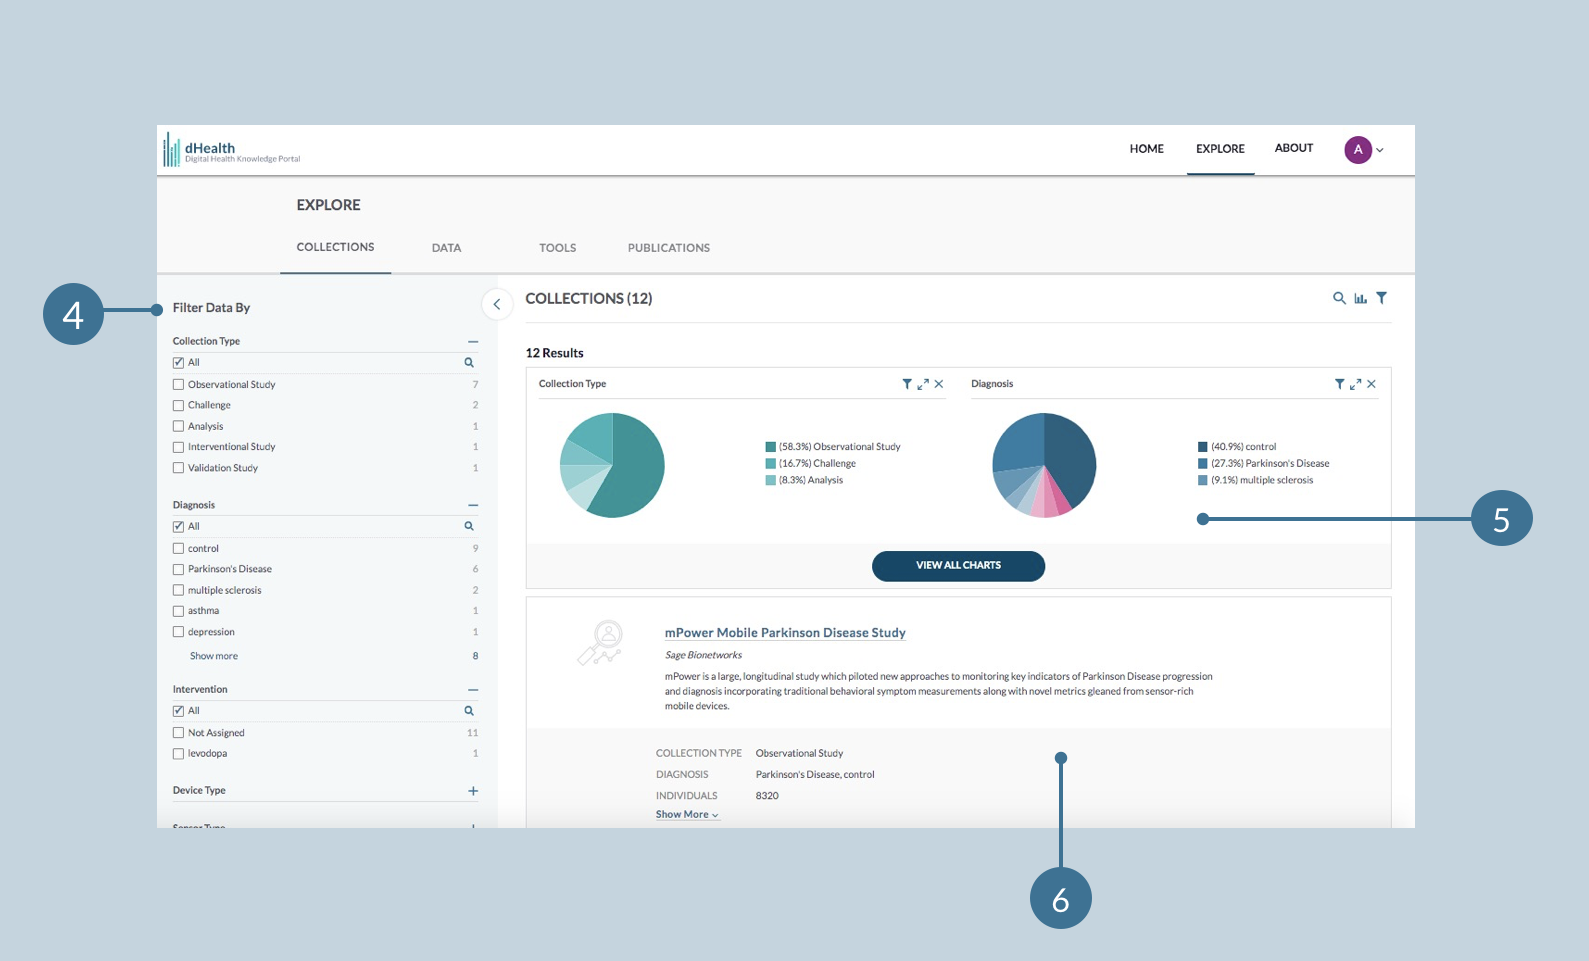
General setup of every Explore page
Learn how to use the filtering and visualization tools here: Exploring Data.
Collections
Use the Explore - Collections page to browse and query for the studies leveraging digital health technology, which are featured on the portal, as well as analytical efforts and benchmarking challenges to interpret and develop digital measures from digital health data. Using the filtering tools on the left (4) or the visualization tools (5), you can narrow down your search and generate a list of collections that will appear under the visualizations (6).
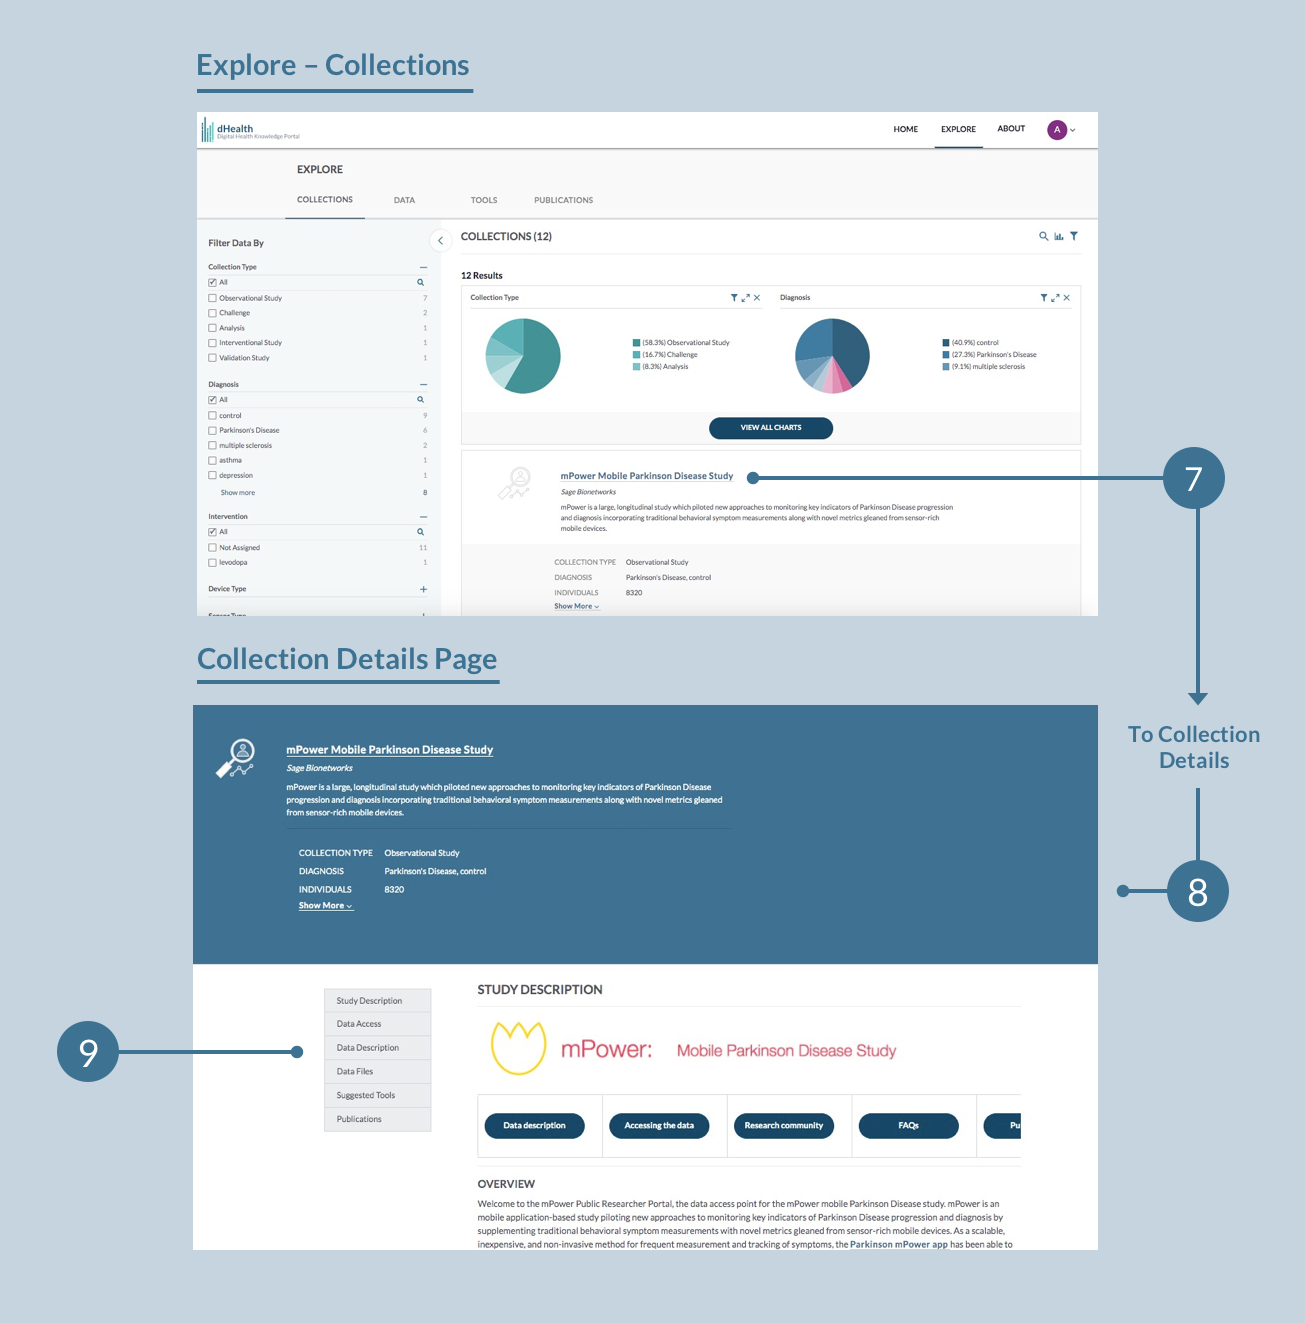
Click on the name of any collection on a Collection Card (7) to visit the corresponding Collection Details page (8). On this page, use the table of contents on the left (9) to scroll through and see the various details related to the study, analysis, or benchmarking challenge.
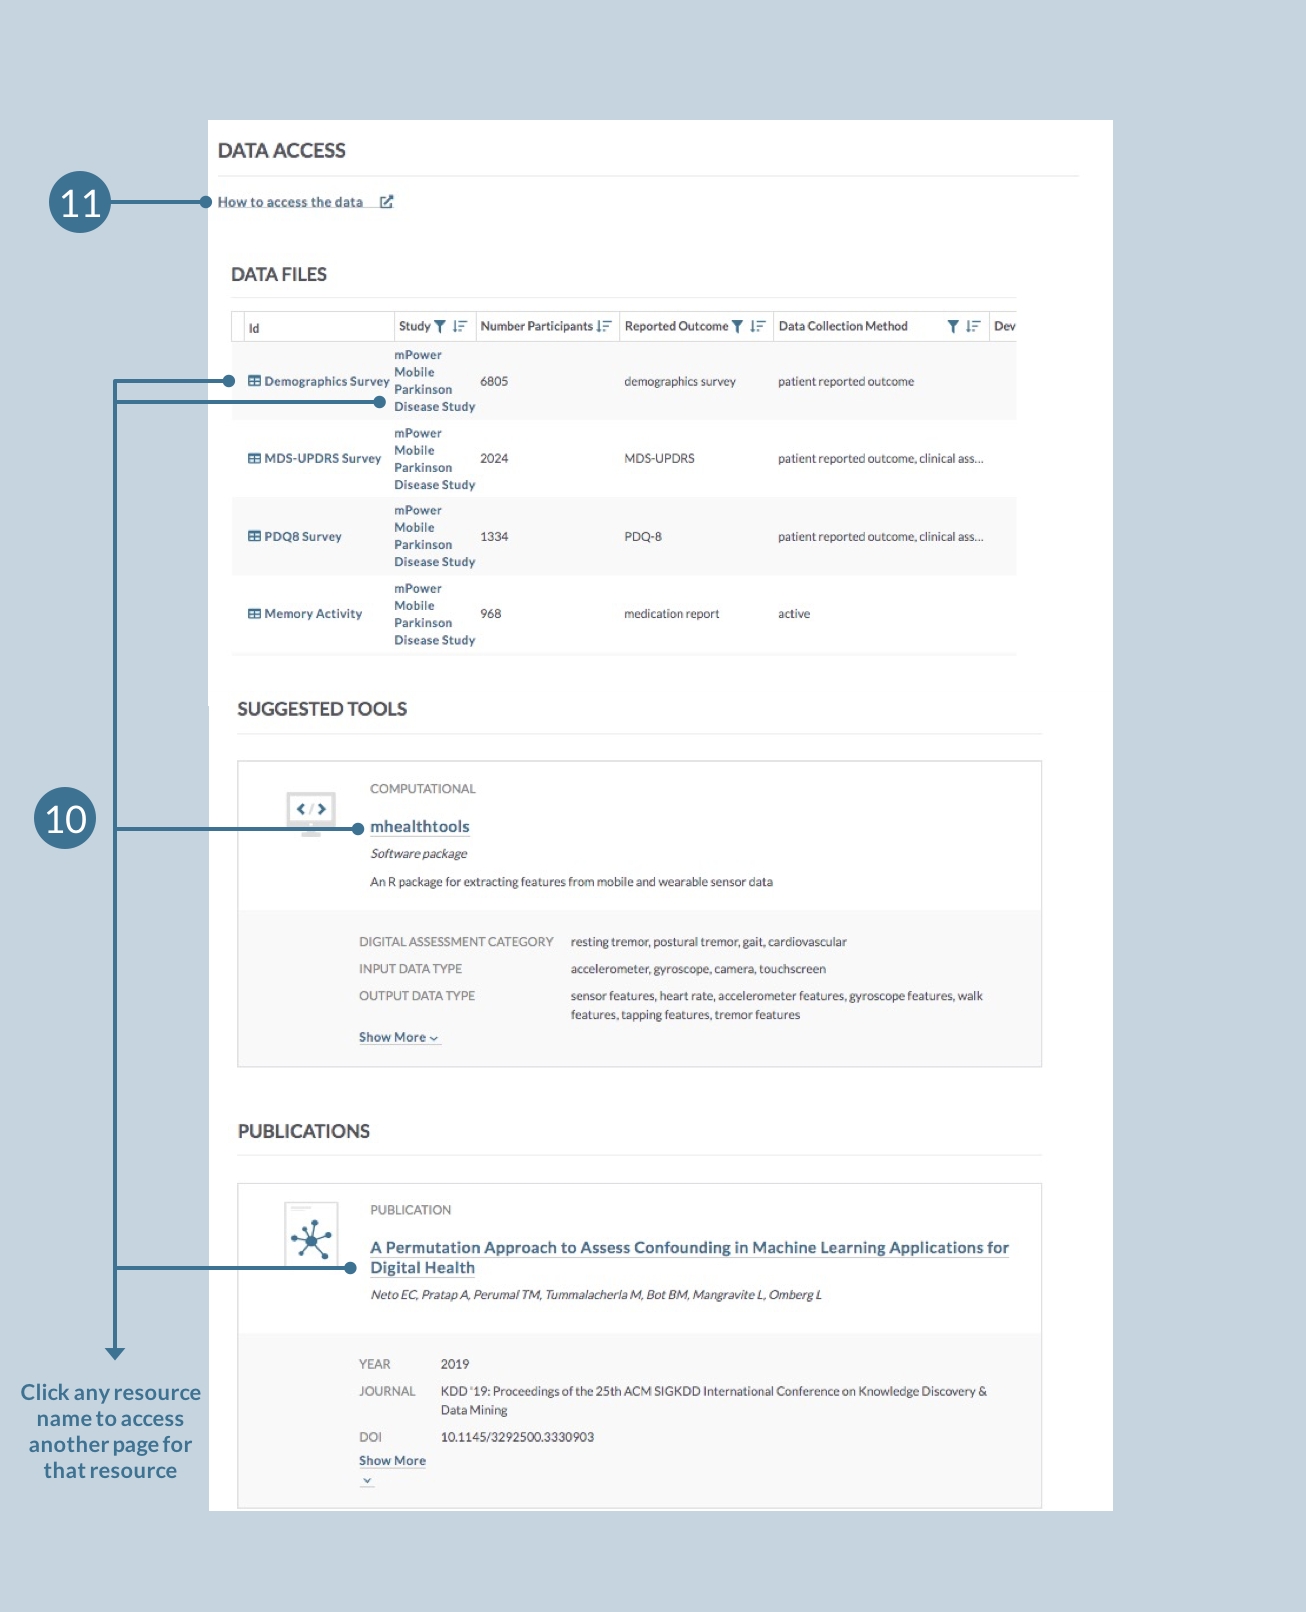
Throughout the Details page, there are various clickable items (10) which will take you to another page when clicked, either elsewhere in the portal, in Synapse, or another external repository. Specifically, notice the Data Access section—this includes a How to access the data link (11), which will direct you to instructions in Synapse on how to access the data.
Data
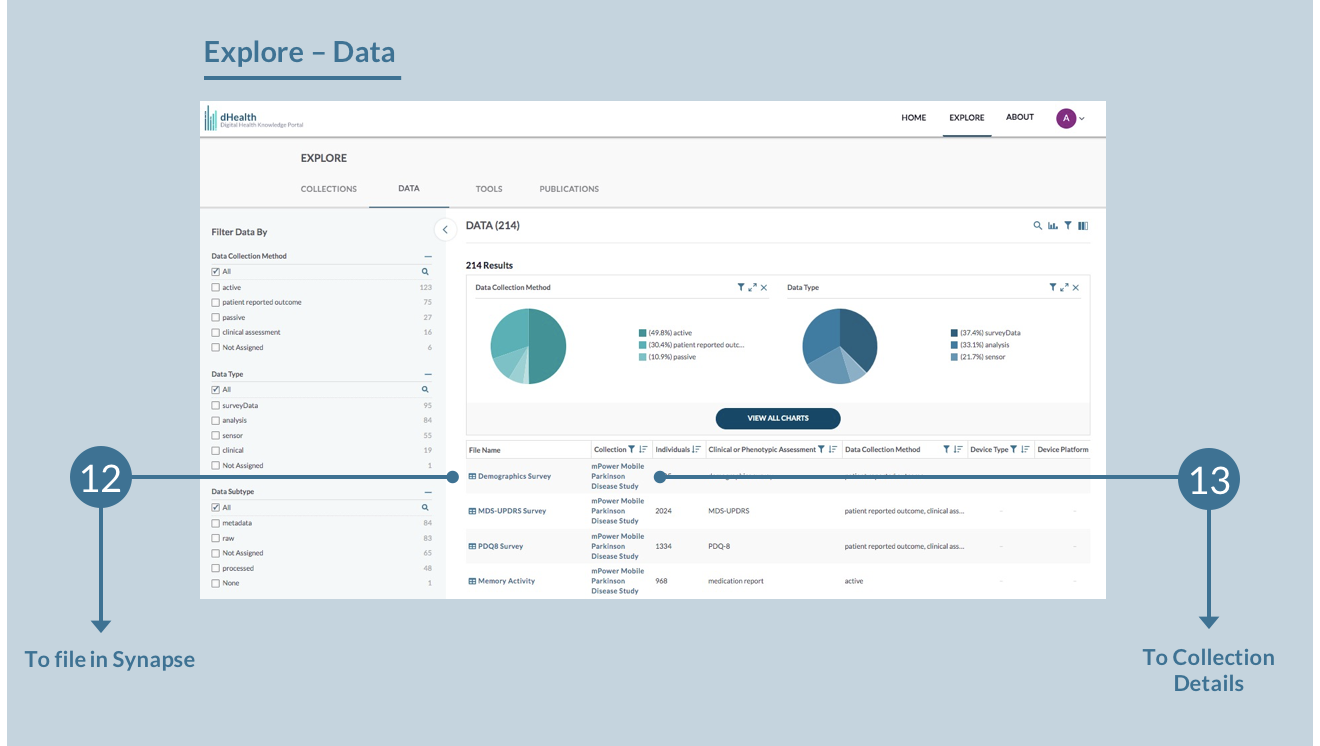
Browse the Explore - Data page for raw and processed data from the studies, analysis, and benchmarking challenges catalogued in this portal. Use the filtering tools on the left (4) or the visualization tools (5) to narrow down your search and generate a list of custom queried data that will appear under the visualizations (6).
For example, if you were interested in accelerometer data from studies of Parkinson’s disease, you could use the filtering or visualization tools to quickly identify available data.
In the resulting query, click on any File Name (12) to visit that file directly in Synapse, or Collection (13) to visit the corresponding Collection Details page (8).
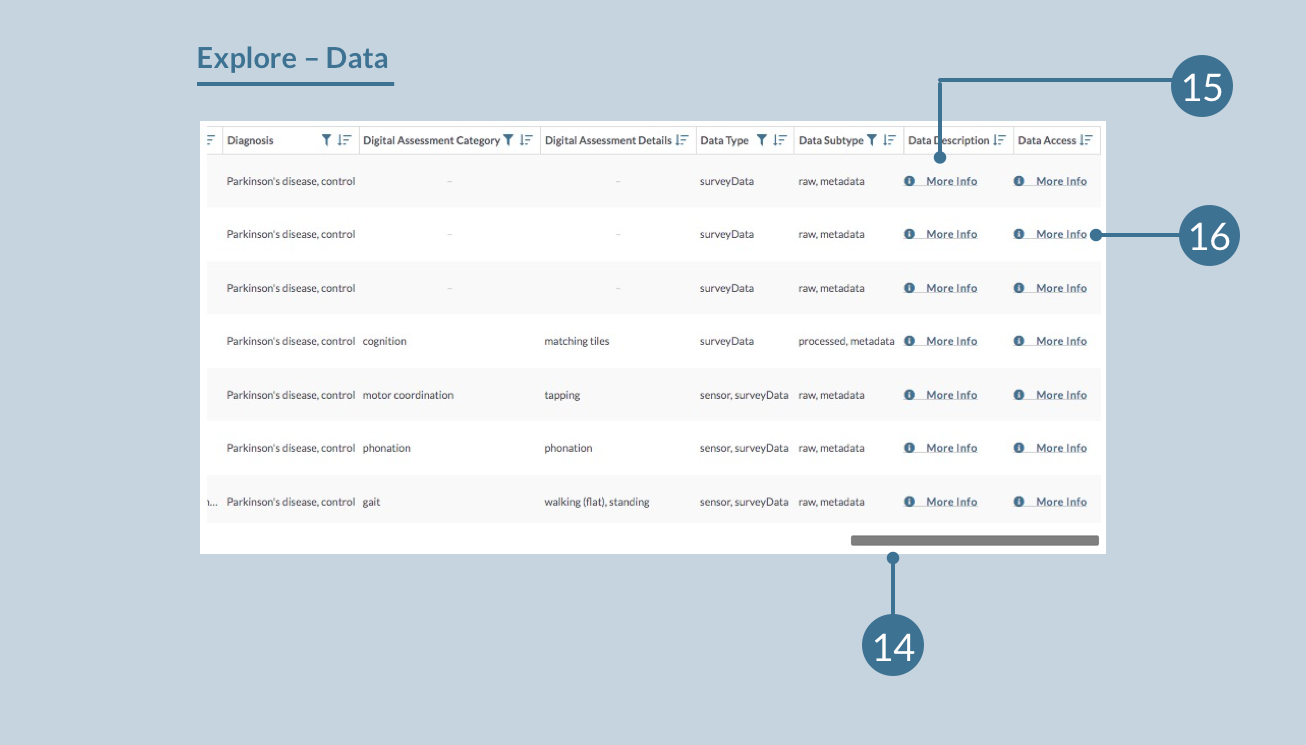
Using the scroll bar located at the bottom of the query (14), scroll to the last two columns of the table. The Data Description column (15) links to detailed descriptions of the data, and the Data Access column (16) links to information and instructions about accessing the data from that study, analysis, or benchmarking challenge. The ![]() More info links provided in these columns will direct you to these respective pages in Synapse.
More info links provided in these columns will direct you to these respective pages in Synapse.
Tools
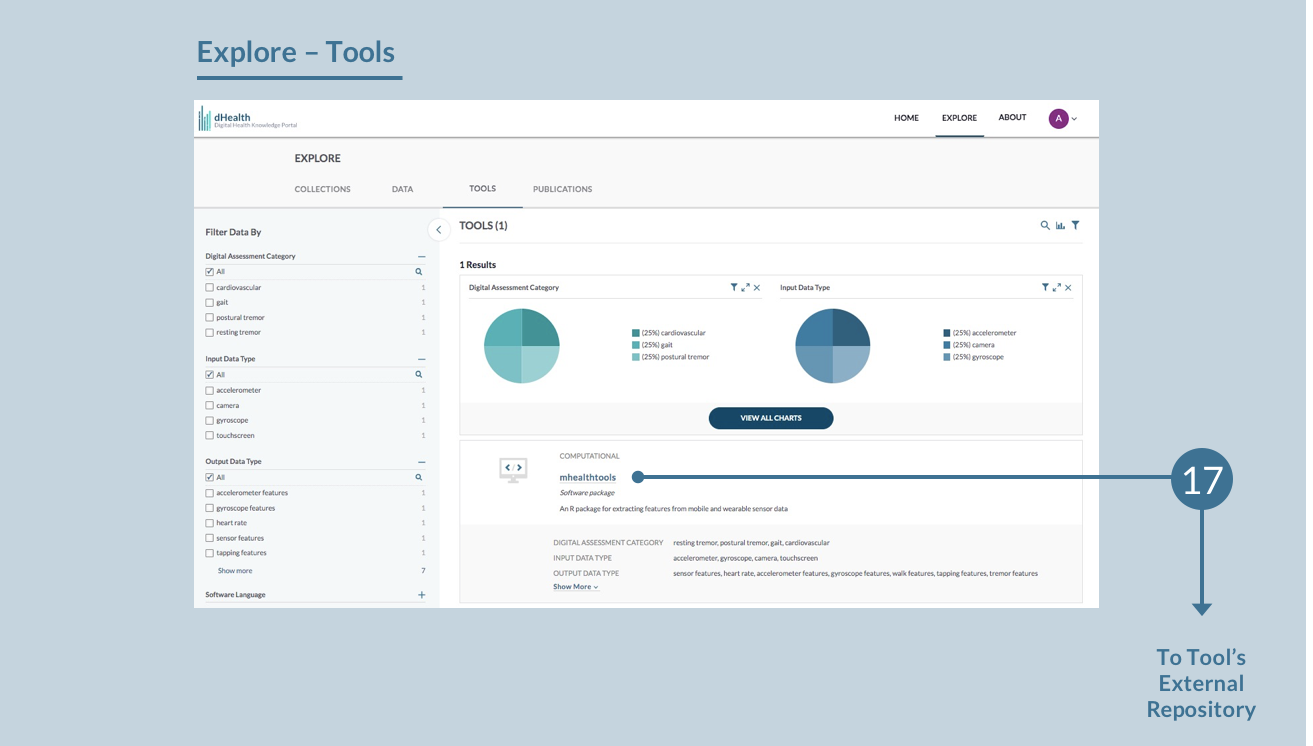
Browse the Explore - Tools page to explore the computational resources used in the processing and analysis of digital health data. Use the filtering tools on the left (4) or the visualization tools (5) to narrow down your search and generate a set of custom queried tool cards that will appear under the visualizations (6).
Click on the name of any tool on a Tool Card (17) to visit the external repository for that tool.
Publications
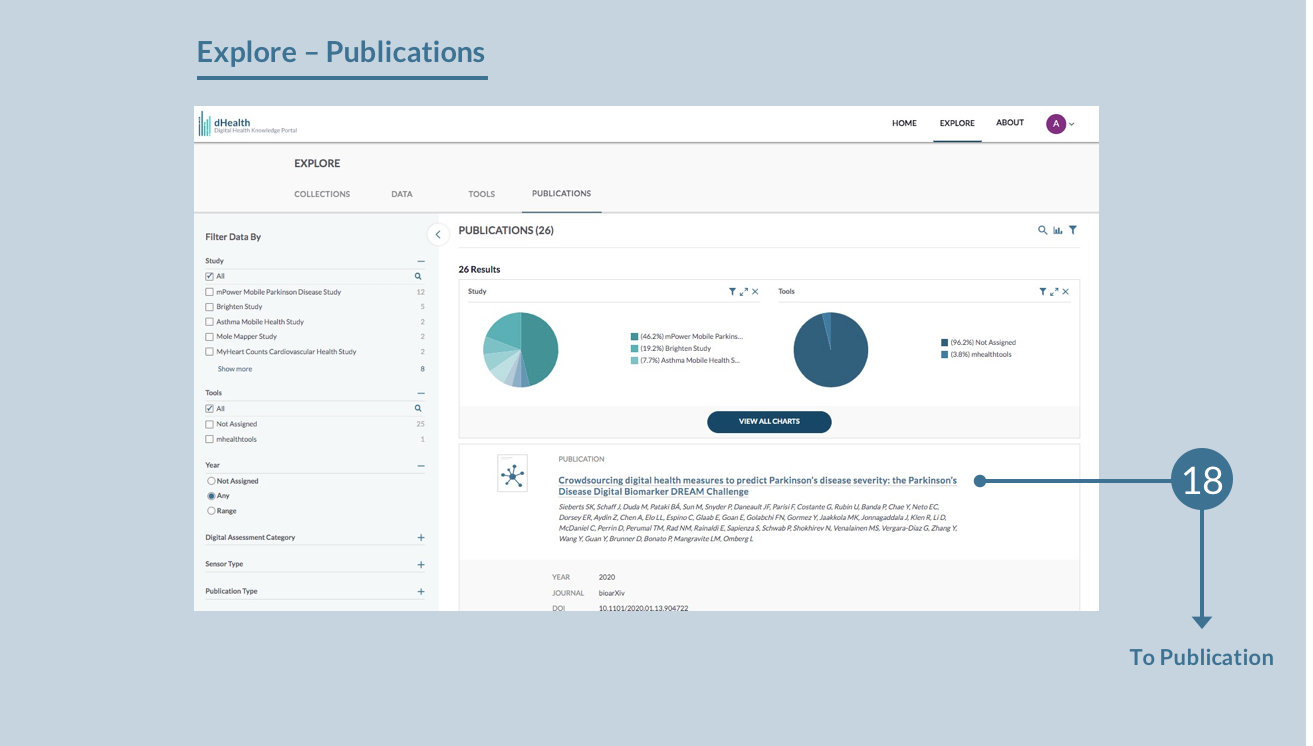
Browse the Explore - Publications page to explore the lessons learned and models built from digital health data, documented in peer-reviewed journal articles. Use the filtering tools on the left (4) or the visualization tools (5) to narrow down your search and generate a set of custom queried publication cards that will appear under the visualizations (6).
Click on the name of any publication on a Publication Card (18) to visit that publication (in an external tab).
Wondering how to use the filtering and visualization tools on each Explore page? See Exploring Data for instructions.